Category: Administration
-
Applicazioni con pacchetti non installabili o non reinstallabili: come risolvere usando PowerShell
Di recente mi è capitato di dover gestire un problema banale ma curioso, uno di quelli su cui pensi una volta risolto: “ecco, questo per il futuro devo davvero ricordarmelo!” Siccome è una di quelle cose che può essere utile a tutti nella vita di tutti i giorni, ho pensato di condividerlo brevemente. Il problema…
-
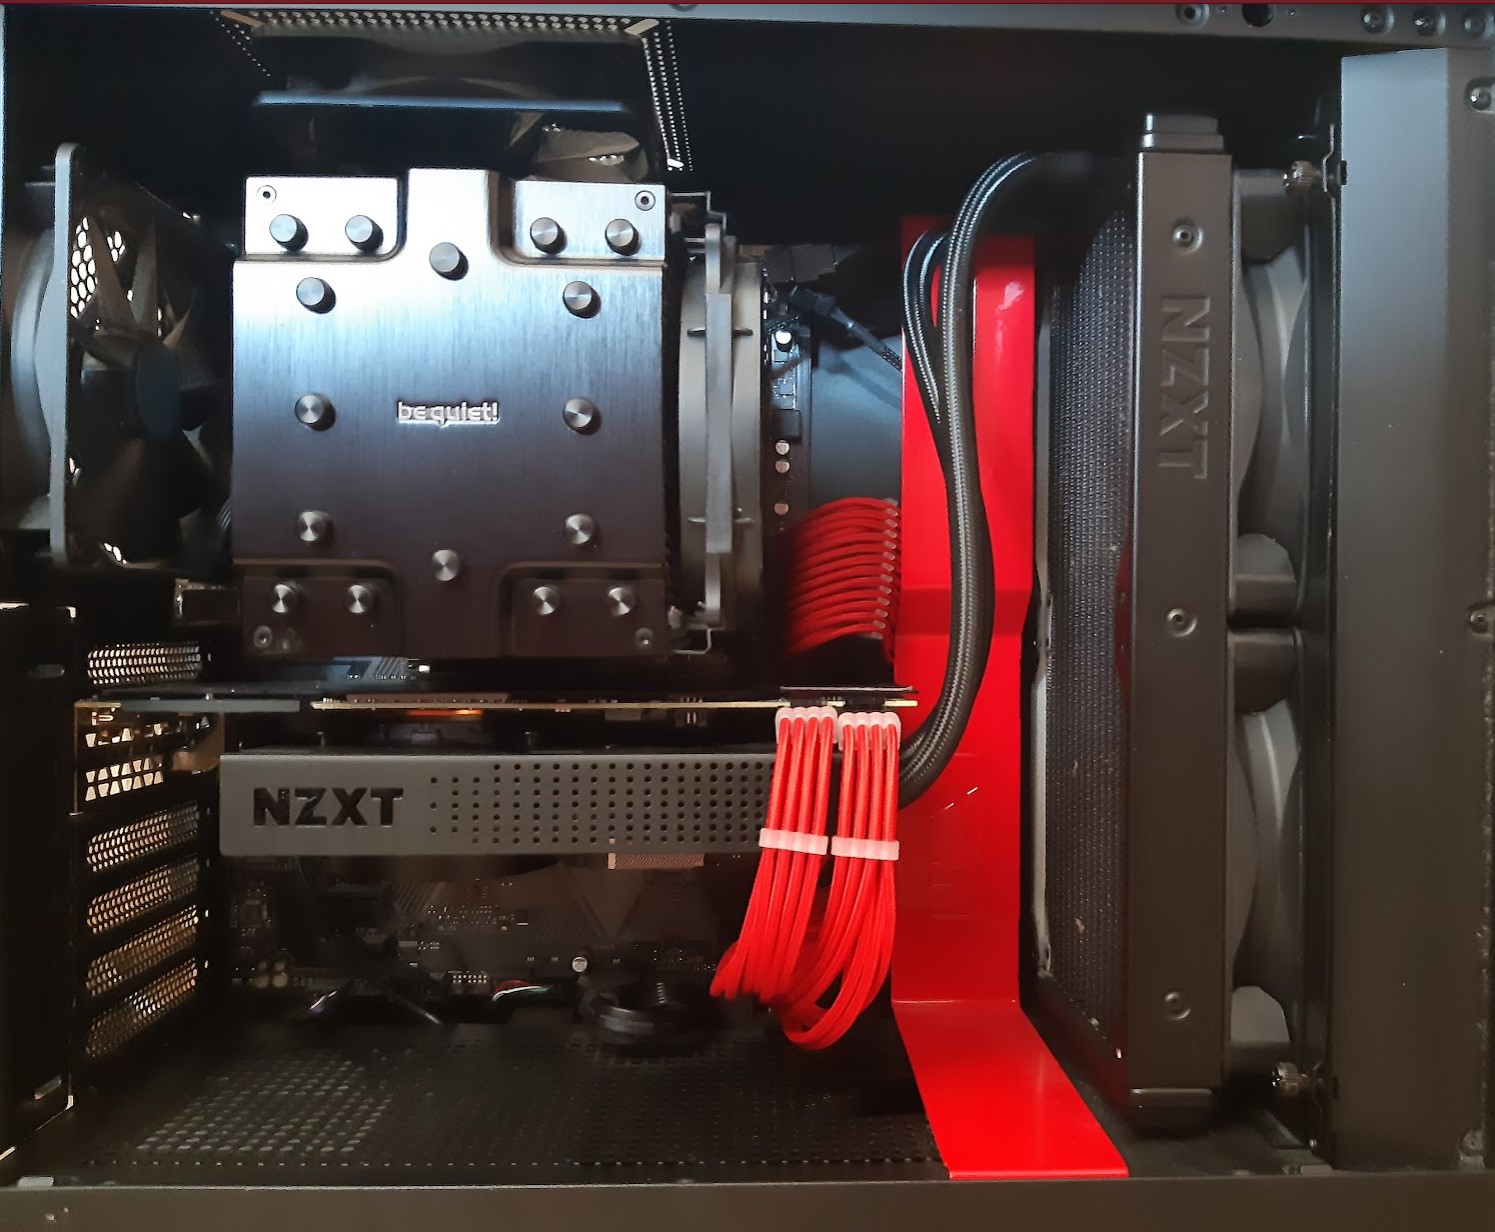
Raffreddare a liquido la GPU: Test con NZXT Kraken X63 su Rtx 2080
La mia esperienza nel montaggio di un dissipatore all-in-one NZXT Kraken X63 con adattatore NZXT Kraken G12
-
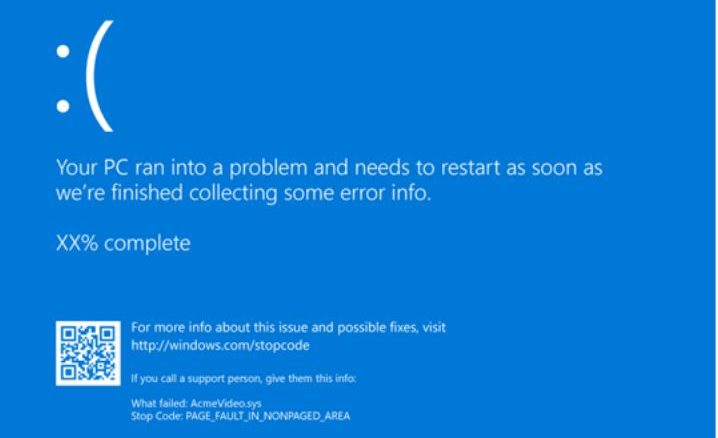
Appunti sulla risoluzione di un blue screen
A volte le workstation ci sorprendono nel peggiore dei modi: la mia Windows 10 Pro x64 ha cominciato a bloccarsi in modo completamente inaspettato. Quello che è seguita è stata un’analisi sistematica che ha portato, alla fine, a una causa hardware precisa. Queste sono le note di quel troubleshooting. Il problema Il blocco si manifestava…
-
Recover a database with a DAMAGED and/or LOST log file
A corrupted or missing transaction log file is one of the most stressful situations a DBA can face. The first instinct is to restore from the last full backup — but depending on the circumstances, SQL Server offers faster recovery paths that minimize both downtime and data loss. This article walks through the two main…
-
Monitoring Wait Events of a single Session or Query in SQL Server
When troubleshooting a slow query or a specific application session, the instance-level wait statistics in sys.dm_os_wait_stats are too coarse: they aggregate wait events from all processes since the last restart. Resetting the view with DBCC SQLPERF is also problematic on busy instances where hundreds of other sessions generate noise. SQL Server 2008’s Extended Events framework…
-
Anayze SQL default trace to investigate instance events
SQL Server runs a lightweight background trace called the default trace that records a wide range of server-level events: database auto-growth events, object creation and deletion, login failures, server configuration changes, and more. It’s often the first place to look when investigating an incident that didn’t make it into the error log. This article shows…
-

Queries to see rapidly what your MySql is doing NOW
When troubleshooting a slow or unresponsive MySQL instance, the first step is always the same: find out what is happening right now. These quick diagnostic queries use MySQL’s built-in SHOW STATUS and SHOW PROCESSLIST commands to surface the most useful information in seconds — no external tools required. 1. Active Processes and Running Queries SHOW…
-
SQL Jobs Monitoring: check last run datetime and duration
SQL Server Agent jobs are the backbone of automated database maintenance: backups, index rebuilds, integrity checks, ETL pipelines. Knowing at a glance when each job last ran and how long it took is essential for fast daily monitoring, especially when managing multiple instances. This query reads directly from the Agent system tables in msdb and…
-
How to make your databases smaller and faster: find unused indexes
Indexes are one of the most powerful performance tools in SQL Server — and one of the most overlooked sources of overhead. Every index you create must be maintained on every INSERT, UPDATE, and DELETE operation. Unused indexes cost you disk space, backup time, memory, and write performance, without providing any read benefit. Finding and…
-
Queries to see rapidly what your SQL Server is doing NOW
When troubleshooting performance issues on a SQL Server instance, the first step is always to understand what is happening right now: which queries are running, which sessions are blocking others, and where time is being spent waiting. These three T-SQL scripts give you an immediate picture of the current workload using Dynamic Management Views (DMVs).…