If you’re a PC gaming enthusiast, you know how important it is to get the best possible performance from your hardware. With the rapid evolution of games and technology, the need to optimise your computer to ensure not only excellent performance but also good component longevity has become crucial. This desire stems both from the wish to maximise the investment and from the pure passion for computer tuning that many of us, myself included, have always had.
This passion drives us to always seek that “something extra” beyond simple routine maintenance.
In the world of PCs, servers or Information Technology in general, this “something extra” translates into two key words: “Fine Tuning”.
The Importance of Objective Measurement in Tuning
To be effective, tuning requires objective measurements. Without adequate measuring tools, it risks becoming an extremely subjective process — done “by feel” — that rarely achieves its set objectives. This often leads to excessive spending with disappointing results, without even realising it, precisely because there is no real reference point to compare against.
A good tuning process in IT, just as in any other discipline, always begins with an initial objective measurement. In technical jargon this is called an “assessment” — a preliminary evaluation in which data is collected to understand the starting situation. Starting from this data, you define the objectives you want to achieve and estimate the costs required. You then carry out the first interventions and measure again. If the objective hasn’t been reached yet, you intervene again, measure again, and so on, until the goal is completely achieved.
This is the only way to do tuning objectively: work with numbers. There are no alternatives. Working without data leads to continuous modifications, dissatisfaction and interventions driven by emotion, which end up leaving a bitter taste — having no objective reference that guarantees real improvement and the achievement of the desired result.
My Monitoring Solution for the Gaming PC
Starting from these premises, to optimise my gaming PC I developed a monitoring solution based on Home Assistant. To this platform, which I already had running on a Raspberry Pi, I added some key elements, all from the open source world. Let’s look at them together.
- Data Collection Agent: Open Hardware Monitor
The first indispensable element is a software agent to install on the PC to collect all the data of interest. In my case, I chose Open Hardware Monitor. This is a completely open source tool capable of detecting and showing in real time a wide range of metrics from your PC, such as temperatures, fan speeds, CPU and GPU loads, and much more. Its great advantage, fundamental for our purpose, is the ability to expose a web server. This allows an external probe (in our case Home Assistant) to periodically collect metrics and store them historically. - Integration with Home Assistant
Next, on our Home Assistant server, we’ll install and configure the necessary integration to communicate with Open Hardware Monitor. This means configuring Home Assistant to collect data from our OHM agent, telling it the IP address where it can reach it on the local network. - Time-Series Database: InfluxDB
Once data collection has started, it’s essential to store all these values in a database optimised for time series. Time series are continuous sequences of values that produce enormous amounts of data, which need to be saved with the minimum possible resource expenditure. For this purpose, my choice fell on InfluxDB, an extremely efficient database that integrates easily within Home Assistant. - Data Visualisation: Grafana
Finally, but no less important, it’s necessary to represent this data in a readable and intuitive way. I chose Grafana, a lightweight and agile tool capable of handling large amounts of monitoring data. Grafana is also open source and has long been optimised for visualising time series, capable of handling data volumes far greater than those we’ll collect with our home monitoring.
Once these elements are configured, you can create your own custom dashboards and charts, essential for keeping track of the variables you want to work on. In my case, I focused particularly on resource consumption (CPU, RAM, GPU), power consumption and above all the operating temperature of the various components.
Useful Resources for Installation
Here are the useful references to start from and some guides for implementing this solution:
- Installing Home Assistant on Raspberry Pi : https://indomus.it/formazione/home-assistant-su-raspberry-pi-varie-installazioni-le-cose-da-fare/
- Download and install Open Hardware Monitor : https://openhardwaremonitor.org/
- Configure the OHM integration : https://www.home-assistant.io/integrations/openhardwaremonitor/
- Install and configure InfluxDB for Home Assistant : https://www.home-assistant.io/integrations/influxdb/
- Install and configure Grafana : https://community.home-assistant.io/t/home-assistant-community-add-on-grafana/54674
It’s important to emphasise that setting up what has been described is not a quick process and is primarily recommended for enthusiasts who want to create a home automation and monitoring platform. This platform, once built, can also be useful for other purposes: you can create charts of your home temperature, monitor appliance consumption and collect data from any home sensor compatible with Home Assistant.
But I can guarantee that once created, this solution will give you great satisfaction thanks to the possibility of customising it completely to your liking.
Data Analysis: Practical Examples
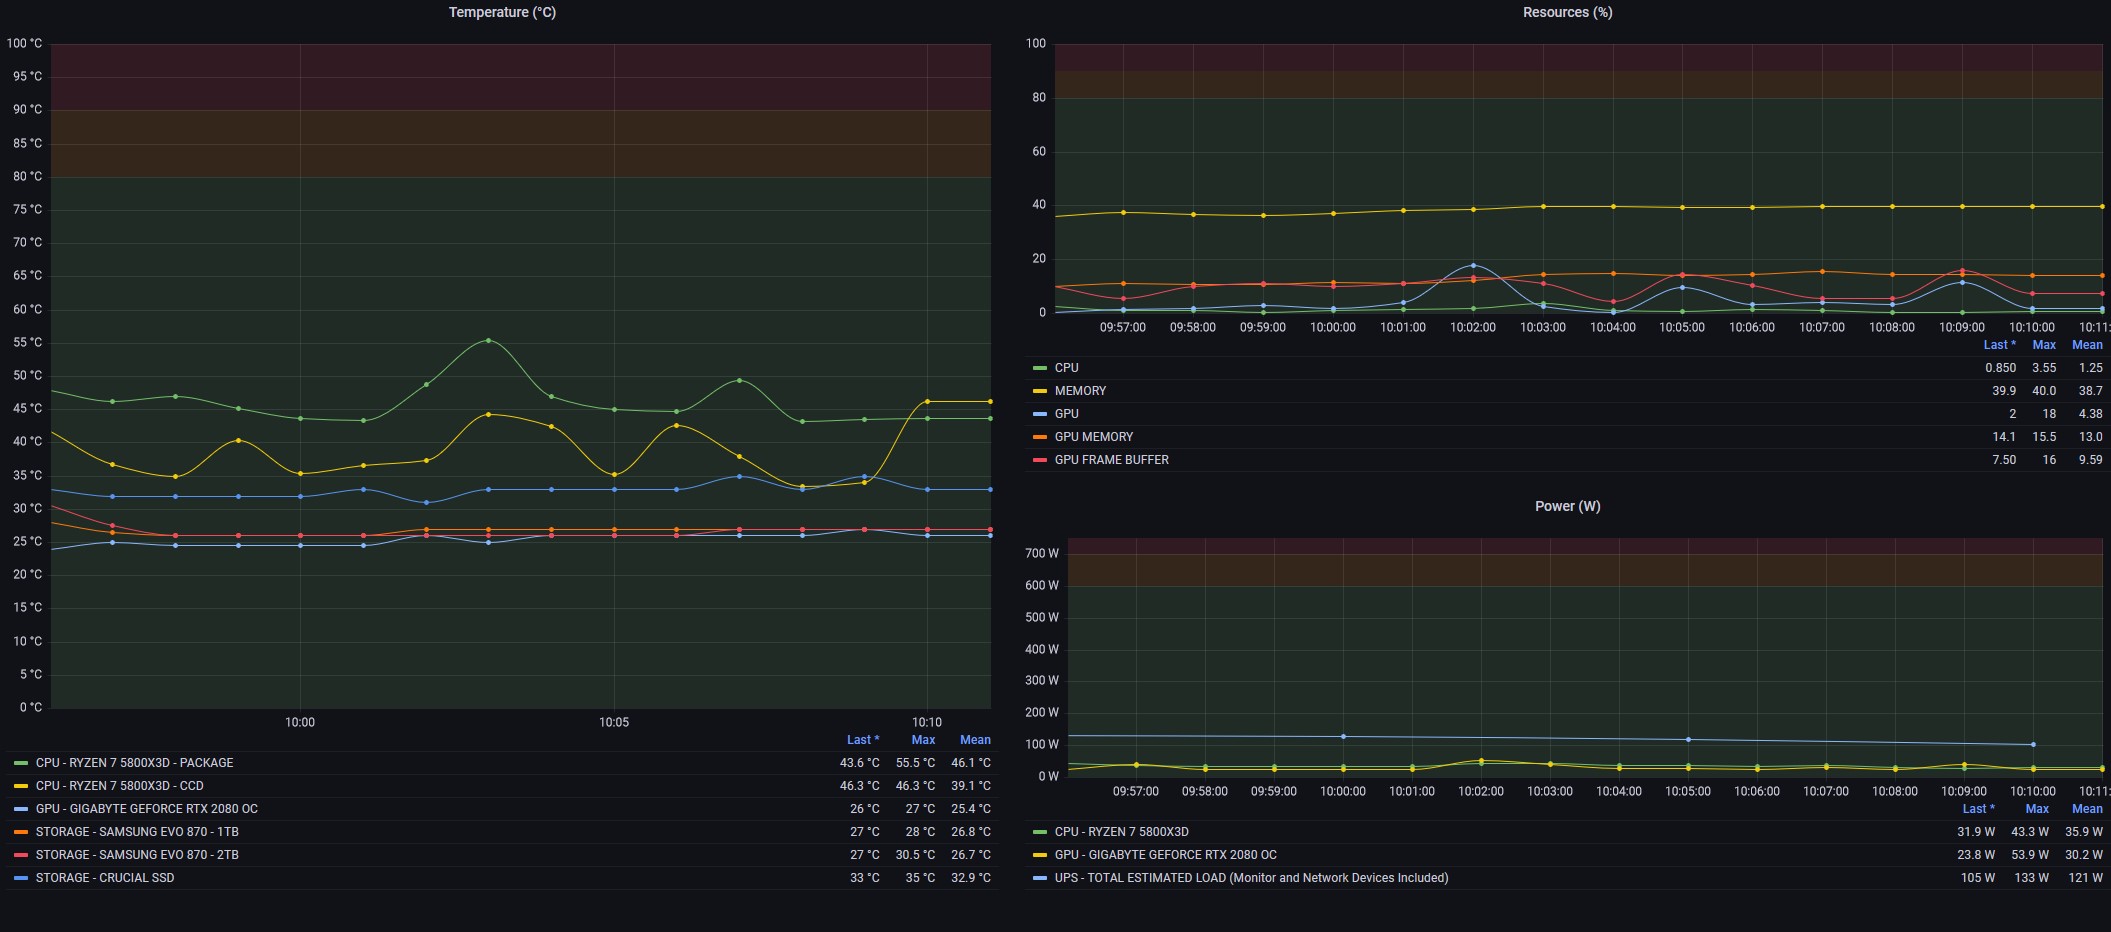
Here are a couple of charts I created, documenting the situation of my PC.
First, the idle situation, with only system activities running after startup:
…and following, a situation of heavy load during a game session of about forty minutes of Spider-Man: Miles Morales (a really well-made title I can only recommend!).
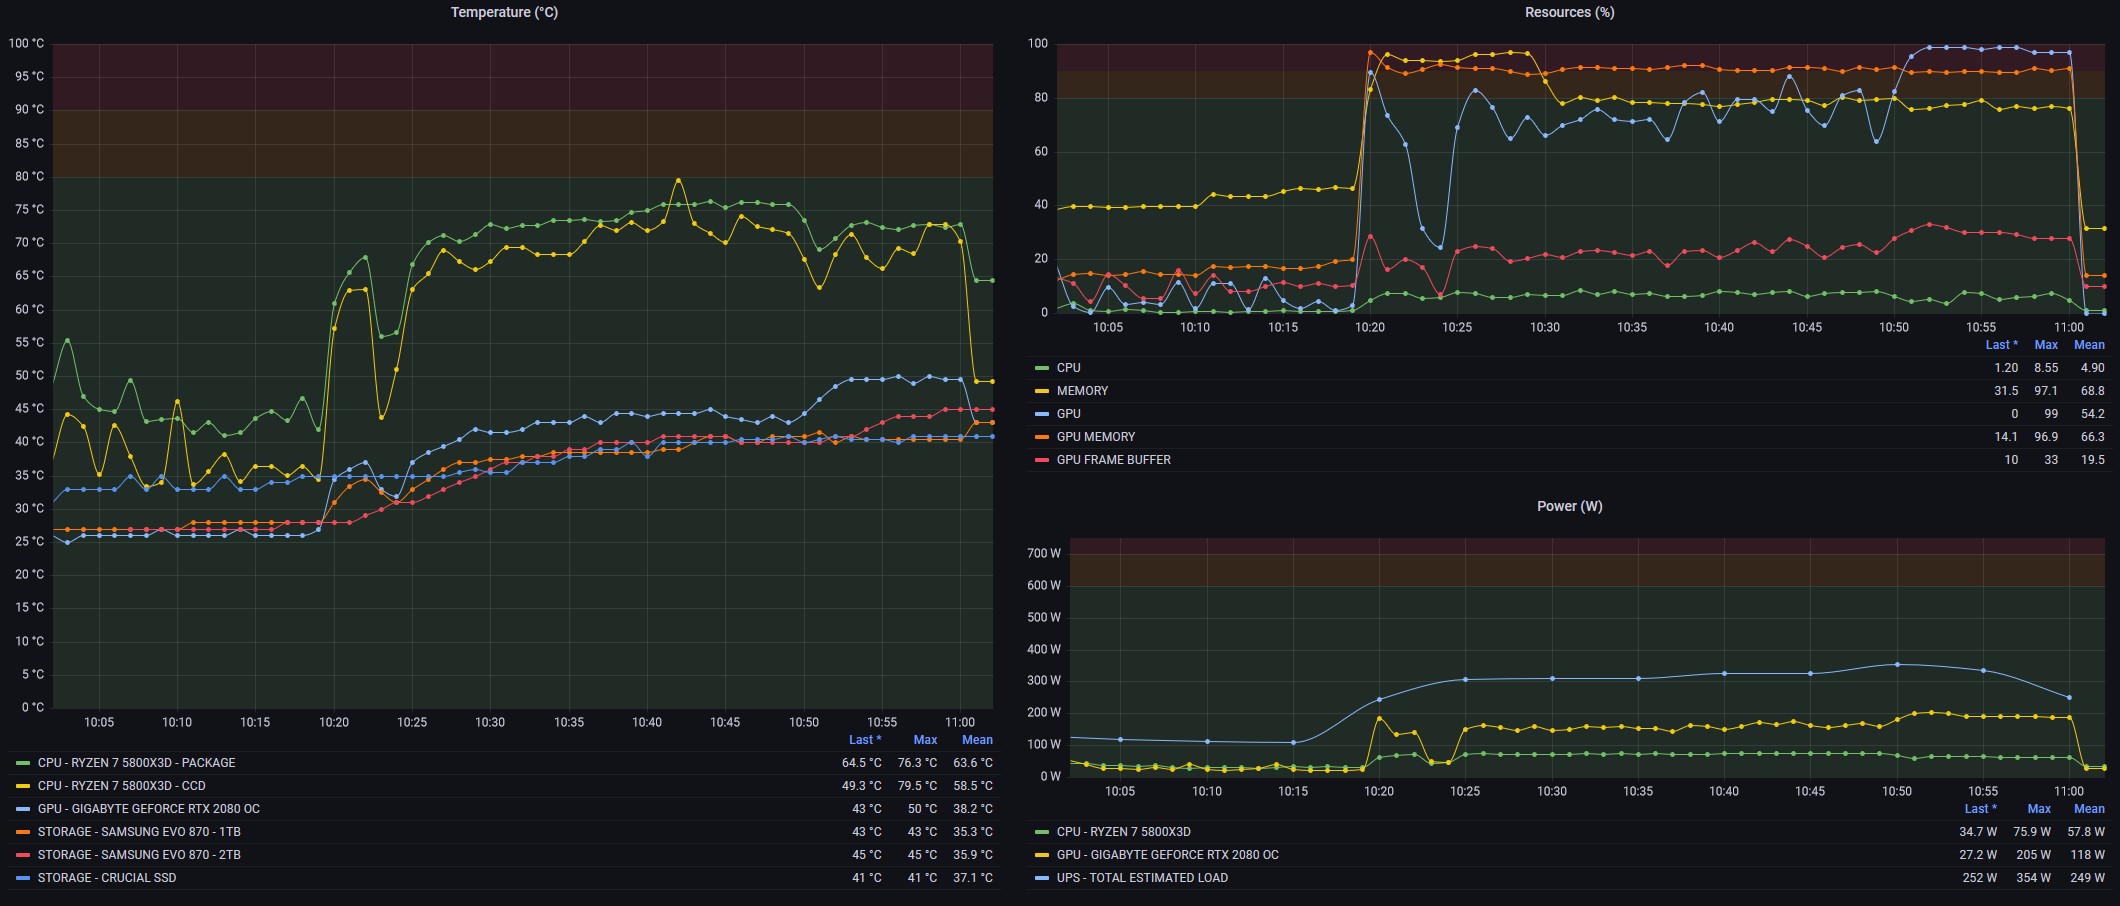
Here are all the objective numbers on which to base your decisions. Do you need to improve your CPU cooling? Do you really need more RAM? Is the GPU temperature stable? All questions you can easily answer by consulting your charts. Then, once you’ve made your interventions, you can go back and look at the charts to verify the impact of the changes… and so on, always trying to do better!
With this I hope to have provided you with a clear, high-level overview of my solution, with all the references necessary to evaluate and plan it according to your needs. For installation, I refer you to the detailed guides in the links provided in the article. It’s obviously a solution for experienced users that requires a certain familiarity with installation procedures and a lot of desire to customise and create a solution that, once completed, will be exclusively yours.
What can I say at this point?
I’d say: Happy Fine Tuning to everyone! 🙂
p.s. a big thank you to my friend GolemWasHere (real name Andre 🙂 ) who gave me all the ideas and tips to put together the solution.